scanSTAT can use a linear systems method to calculate the paradigm vector file (see, Cohen, MS. "Parametric Analysis of fMRI Data Using Linear Systems Methods", NeuroImage 6:93-103, 1997, for more details.), which describes the expected behavior of an "activated" pixel. In this release, the program can calculate correlations of each pixel of the time series with this paradigm vector, thus indicating which pixels are part of an "activated" region.
Tutorial/Demonstration - Statistical Processing of MR Images
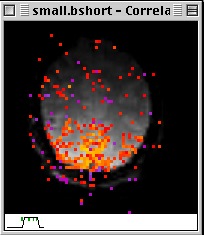
The functional maps will evolve as each new image in the input data is analyzed. Assuming that you have used small.bshort as your time series, 75 images are analyzed to create the final functional map.
The functional map during processing
The functional map after processing is completed
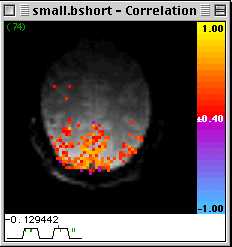
If all has gone properly, you should be looking at a one-slice base image in grayscale with a statistical overlay in color. This time series was acquired during visual stimulation, the timecourse of which is described in the paradigm file small.C.p. As each sequential image is analyzed, you can observe how the statistical overlay changes.
In addition, as the processing progresses, the paradigm reference vector is displayed below the image. Images containing artifacts or motion above threshold are flagged with a colored marker on this display. The color corresponds to the type of artifact detected...see the walkthrough section on artifact detection for more information.