Section 5: Selecting Pixels and Pixel Behavior
Once you have a statistical overlay map, you can get more specific information on the behavior of certain brain regions over time. This can be a useful way to get an idea of the actual intensity changes in specific brain areas during an experimental run.
In this section of the walkthrough, we're assuming that you are beginning where Section 4 left off. If this isn't the case for you (how DARE you ignore our recommendations!?) just take a look at Section 4 and catch up.
- Make sure the Overlay Options box is available, and switch the displayed statistic to Correlation.
- Make sure that the limits are set to a lower limit of 0.4 and an upper limit of 1.0.
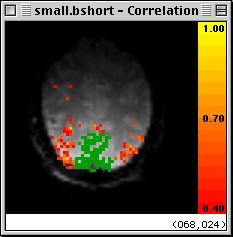
- Click and drag from a point just above and to the left of the large activation region in the image to a point just below and to the right. As you do this, a box should appear enclosing the region you are selecting.
- After you release the mouse button, scanSTAT will examine the time series and bring up a display of the average intensity behavior of those pixels over the course of the experiment. Only those pixels in the region selected which meet the current statistical criteria are included. These pixels turn green to indicate that they are selected.
Selecting a Group of Pixels
Time-Intensity Graph of Selected Pixels
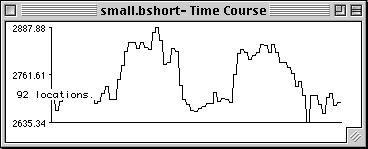
- You can add more pixels to the region by dragging rectangles around additional areas. Try dragging a rectangle around an adjeacent region of activation. scanSTAT will add the behavior of the significant pixels within that region to the calculation and update the intensity behavior graph accordingly.
- When you have selected multiple pixels, you can show the range of intensity of those pixels by selecting Show Range in T-I Graph, under the Display menu.
Additional Pixels Included

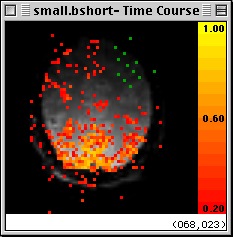
- Now let's take a look at some pixels which are not so well correlated with the paradigm reference vector. First, we need to deselect the pixels which we have already selected. You can do this by holding down the open-apple key while you click on the image. This should change all of the pixels back to the unselected state.
- Open the Overlay Options... screen under the Display menu and change the lower limit of the correlation range to 0.2. Now select some of the diffuse significant pixels in the upper right portion of the image. The time-intensity graph which appears will illustrate that the behavior of these pixels is much less obviously related to the paradigm reference vector.
A Group of Low-Correlation Pixels
Time-Intensity Behavior for These Pixels
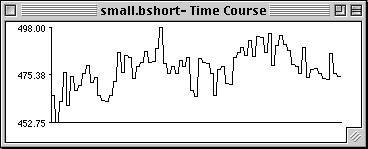
- The time course, (or Artifact Data Series) may also be used to select a particular image for viewing. Clicking on any time point will update the contents of the Image viewing window to show the corresponding image. This can be usfeul in identifying outlier images
- Go ahead and clear these pixels by holding down the open-apple key as you click on the image.
Go back to previous section
Go to the next section
Go back to the main page