Section 6: Artifact Detection
One of the key features of scanSTAT is the ability to detect and partially correct for a variety of artifacts which can produce decrements in image quality. By detecting images in which pixels have changed intensity from background noise to "brain-like" intensities (or vice versa), scanSTAT can identify artifacts arising from subject motion or scanner problems.
Tutorial/Demonstration - Artifact Detection
- From the Statistics menu, select Statistical Options...
- The Dialog window that appears will offer a variety of parameters to control artifact detection. When automatic artifact detection is turned on (the default), the program will watch for various types of changes in pixel intensity which may signal motion or artifacts. The various classes are discussed below.
- Spike artifacts are images which are determined to have change of greater than 10% of pixels from background to brain-like intensities.
- Displacement refers to displacement of the image within the imaging plane, measured in pixels. This derives from center-of-mass calculations for the images, which are also involved in the motion-feedback bullseye display, discussed later in this section.
- "Artifact" can detect changes of intermediate degree.
- Increase/Decrease Ratio compares the number of pixels which change intesity from signal to noise, or from noise to signal, to the difference between the number of pixels in each class. If the subject moves, we would expect the number of pixels increasing and decreasing in intensity to be roughly the same, which will make this ratio large. Thus, sudden increases in this ratio can indicate subject movement. However, spike artifacts or other scanner problems will cause the number of pixels increasing to rise much faster than the number of pixels decreasing, which will not cause as large a change in this ratio. This ratio, therefore, can help distinguish between motion and scanner artifacts.
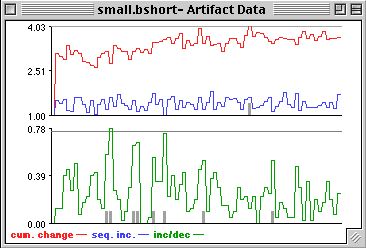
- Use the Show Artifact Data Graph selection on the Display menu to show a graph describing the artifacts. When you do so, three lines will appear. Cumulative change, indicated by the red line, reflects the number of pixels which have changed from background to signal (or vice versa) relative to the first image. Sequential change, indicated by the green line, is the number of pixels which have changed intensity since the previous image. The increase/decrease ratio is indicated by the green line. Images which exceed threshold in any of the categories in the artifact detection section of the Statistical Options... menu item are indicated here by a grey flag under the appropriate graph.
The Artifact Data Graph
You have the option of having scanSTAT attempt to correct for some kinds of artifacts. Select Statistics -> Statistical Options... and notice the check boxes by each of the artifact classes. Checking these boxes will tell scanSTAT that you want it to ignore any images in which the category checked exceeds the indicated threshold. For example, if the box next to "Spike" is checked and the threshold is set to 10%, scanSTAT will not consider any images in which 10% of the pixels have changed intensity from background to signal or vice versa. This may improve the statistical overlay maps.
| Motion artifacts are determined on the basis of the difference in the number of pixels that increase above the noise floor and decrease below it. The control parameter is the percentage of pixels that must change to flag a motion artifact |
| Spikes are detected on the basis of the number of pixels that increase above the noise floor on successive images. A large number (e.g., 25%) is usually appropriate |
| Other artifacts include any significant increase in the number of pixels above the noise floor compared to the first image in the series. |
scanSTAT monitors these artifacts during the statistical calculation. As calculation progresses, you may note that the black line under the image, which represents the paradigm reference vector, is sometimes sprinkled with colored spots. These represent images in which one or more of the artifact categories exceeds the threshold. Green marks represent images in which the increase/decrease ratio exceeds threshold, probably indicating subject motion. Red marks indicate spike artifacts. Grey bars extending over the whole height of the display area indicate images which were ignored in the statistical calculation. You can determine which artifact criteria will lead to an image being ignored by checking the box next to the category in the Statistical Options... screen under the Statistics menu.
For some real-world examples, have a look at Section 6B.
The Motion Bullseye Display
The Displacement category of artifact detection relies on a center-of-mass calculation for the image. When this center of mass shifts, the shift can be detected and quantified, resulting in a method of tracking the direction and degree of subject motion. In addition to using this statistic as a category of artifact detection, scanSTAT can represent it in a graphical form which can be useful for observing subject motion.
Tutorial: Using the Motion Bullseye
- This display can be accessed by selecting Show Motion Bullseye from the Display menu. When you do so, a circular display appears in which subject motion can be plotted.
The Motion Bullseye display
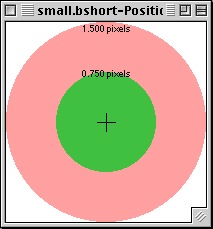
- Note that the numbers at each range of the bullseye are derived from the threshold set in the Displacement category, in the Artifact Detection section of the Statistical Options... box.
- Make sure that you have opened Small.bshort using File -> Open Time Data..., and that you are using Small.C.p as your paradigm file.
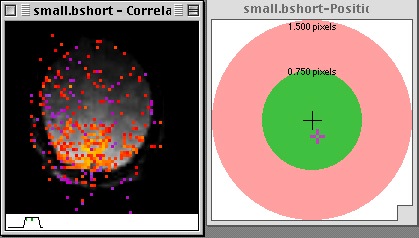
- Select File -> Start Calculation to begin the calculation. During the process, watch as the calculated center of mass of the subject moves within the motion bullseye display.
The Motion display during calculation
Go back to previous section
Go to next section
Go back to main page